How Player Movement Data is Changing the Game for Basketball and Football Bettors
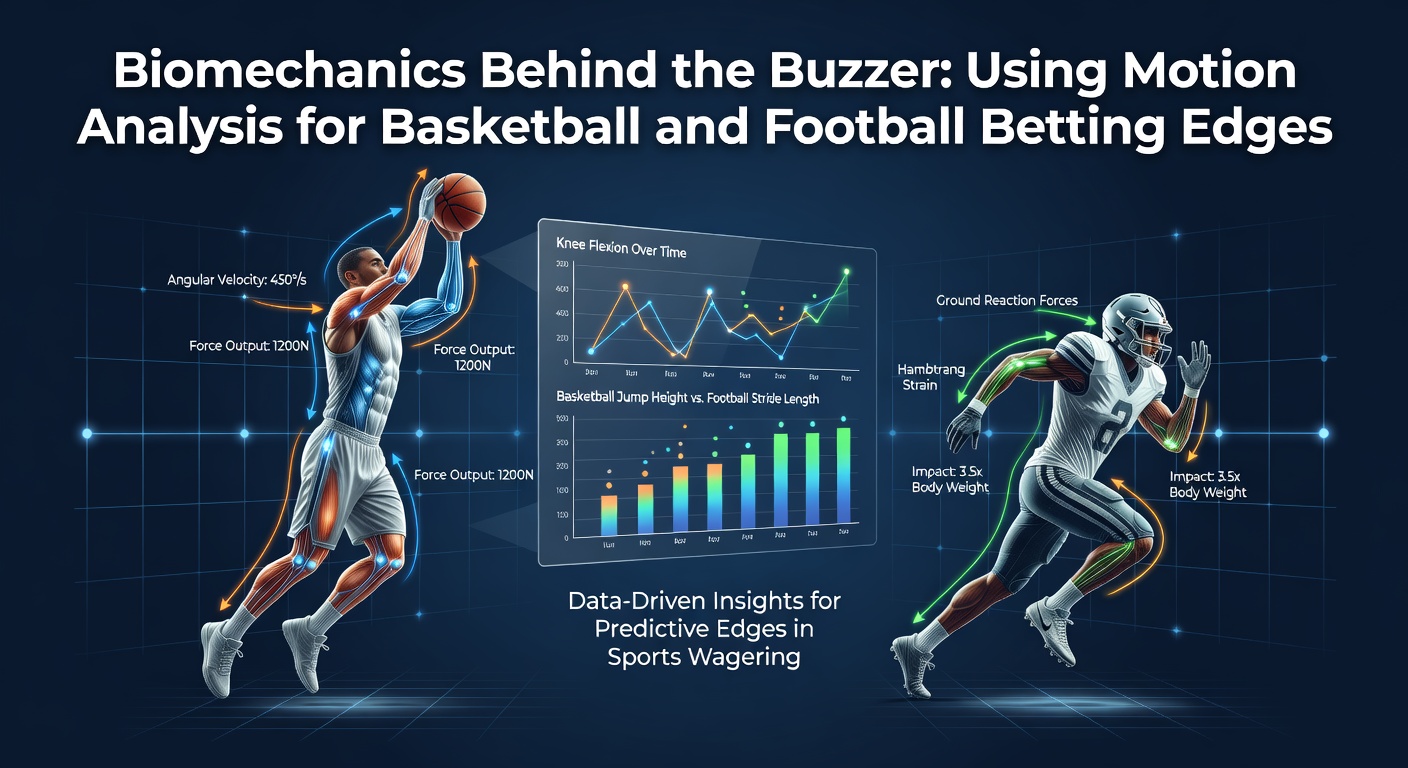
Biomechanics has moved from laboratory settings into professional arenas where teams and analysts track every stride, pivot, and release with precision sensors and high-speed cameras. Data collected from these systems reveals patterns in acceleration, force distribution, and fatigue accumulation that directly influence in-game decisions and long-term player availability. Bettors who incorporate similar metrics gain access to objective indicators that traditional box scores often overlook, particularly when evaluating player props or live market opportunities across basketball and football schedules.
Core Components of Modern Motion Analysis Systems
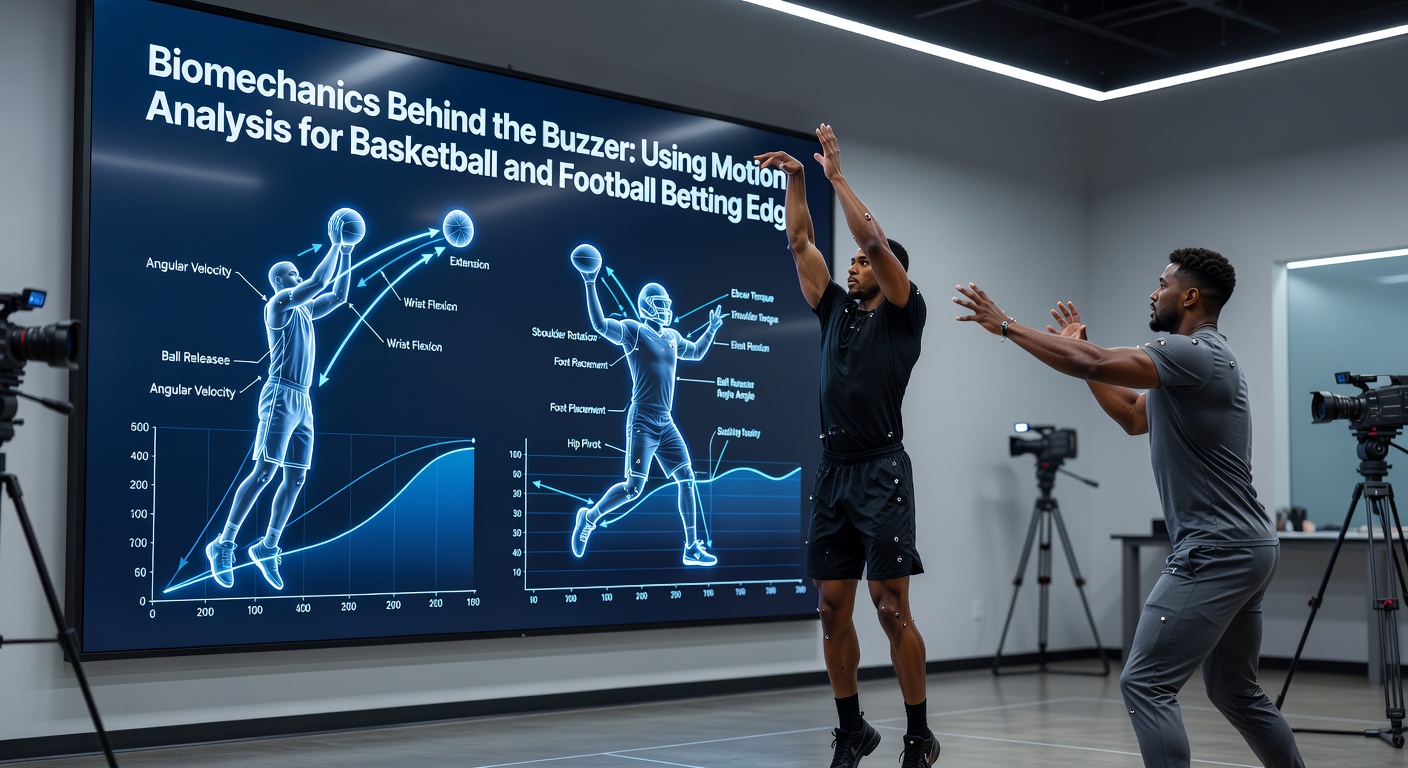
Professional leagues deploy optical tracking cameras alongside wearable devices that measure joint angles, ground reaction forces, and velocity vectors in real time. These tools generate thousands of data points per second, allowing researchers to quantify subtle changes in movement efficiency that occur as games progress. Studies from the American College of Sports Medicine demonstrate that reduced knee flexion during repeated jumps correlates with elevated injury risk, information that becomes relevant when assessing minutes-played props or quarter-specific performance markets in basketball.
Football analysts apply comparable frameworks to monitor sprint mechanics and directional changes on the pitch. Sensors placed on players capture deceleration forces during tackles and rapid turns, data sets that highlight workload spikes capable of affecting second-half output. In May 2026 several top European clubs expanded their use of integrated GPS and inertial measurement units, producing richer longitudinal profiles that feed into both coaching adjustments and external analytical models.
Application in Basketball Performance Markets
Shooting efficiency often declines when biomechanical markers such as elbow alignment or release height deviate from established baselines. Motion analysis software identifies these deviations during warm-ups or early quarters, providing advance signals before they appear in scoring statistics. Observers note that teams using such systems have adjusted rotation patterns to preserve key players whose movement signatures indicate emerging fatigue, trends that translate into value when evaluating over/under points for specific athletes in late-season contests.
Rebounding and defensive metrics also benefit from kinematic breakdowns. Vertical leap repeatability and lateral quickness measurements help quantify how often a player maintains peak explosiveness across multiple possessions. When these figures drop below season averages, sharp bettors adjust expectations for blocks, steals, and second-chance opportunities accordingly.
Football Contexts and Workload Indicators
Running patterns in football reveal similar fatigue thresholds. High-intensity distance covered and the frequency of explosive accelerations serve as proxies for sustained involvement in attacking phases. Research conducted at the Australian Institute of Sport shows that players exceeding certain weekly workload thresholds experience measurable reductions in top-end speed during subsequent matches, a factor worth monitoring for anytime goal or assist markets.
Defensive actions such as pressing and recovery runs generate distinct force profiles that analysts compare against historical norms. When cumulative loading appears elevated, clubs sometimes reduce minutes for pivotal defenders, altering clean sheet probabilities and player-specific booking lines. Bettors who track these workload reports alongside fixture congestion calendars obtain additional context for in-play positioning.
Integrating Biomechanical Signals into Betting Workflows
Publicly available reports from league partners and academic collaborations now include selected kinematic summaries released after matches. Cross-referencing these releases with betting exchange movements allows individuals to identify discrepancies between market pricing and underlying physical data. One study revealed that early detection of altered stride length in basketball players preceded drops in points-per-minute by several games, giving prepared analysts time to adjust position sizes before odds responded.
Live betting environments present further opportunities because motion data streams update continuously. Sudden changes in acceleration profiles during a basketball timeout or a football substitution window can indicate tactical shifts or individual limitations that bookmakers incorporate with varying speed. Those monitoring the same feeds gain a narrow window to act on emerging information.
Conclusion
Motion analysis continues to expand the range of measurable variables available to both teams and external observers. As sensor technology improves and data-sharing practices evolve, the granularity of biomechanical insights will likely increase further. Individuals who systematically review these indicators alongside conventional statistics position themselves to recognize performance deviations earlier than the broader market, particularly in basketball and football contests where small physical margins determine outcomes.