Charting Travel Fatigue Effects on Serve Percentages Across Global Tennis Circuits
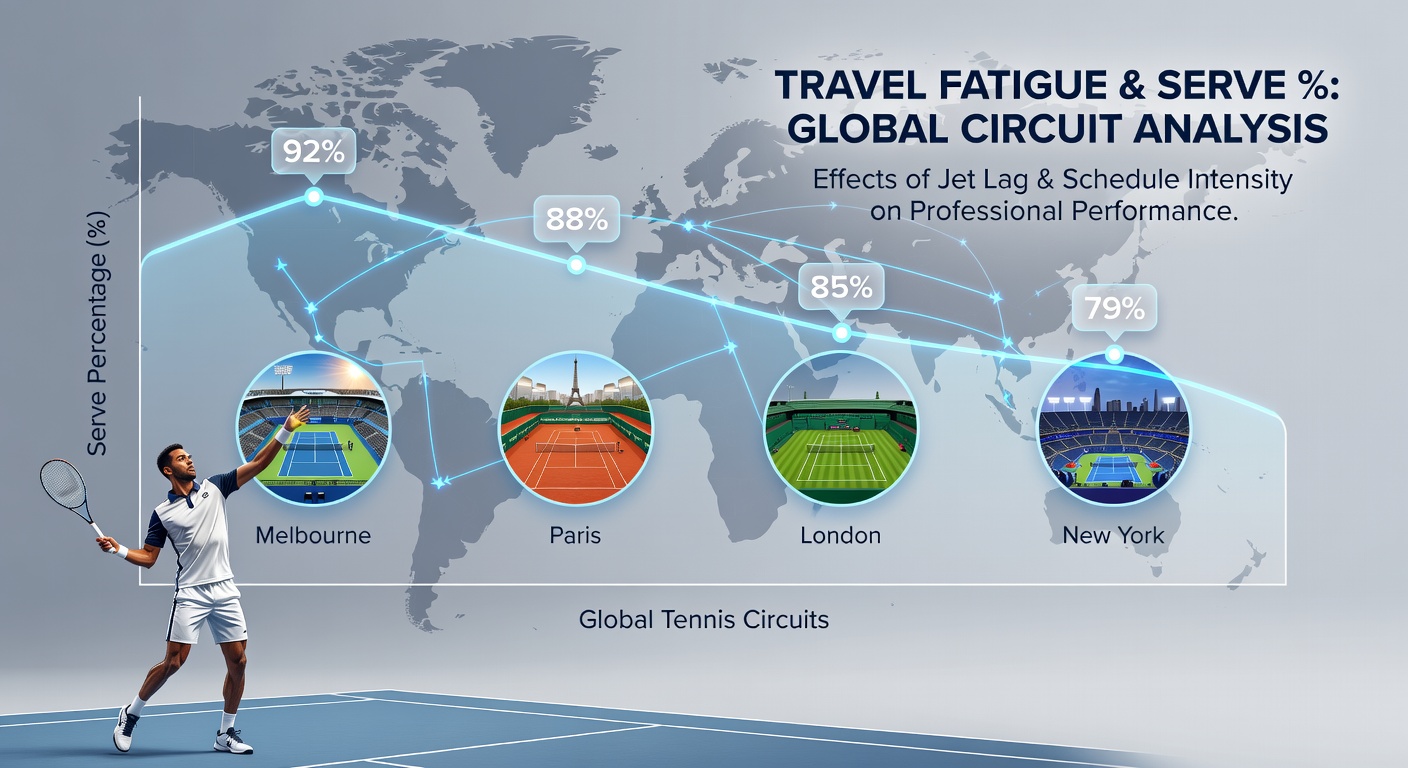
Professional tennis schedules demand frequent long-distance travel between tournaments on the ATP and WTA tours, and researchers have documented clear connections between these journeys and shifts in serve performance metrics. Data compiled from multiple seasons shows that serve percentages often decline in the initial matches following extended flights, particularly when players cross multiple time zones or move between surfaces with minimal recovery windows. Observers tracking global circuits note these patterns emerge consistently across hard courts in Australia, clay events in South America, and indoor stops in Europe.
Patterns Observed in ATP and WTA Data
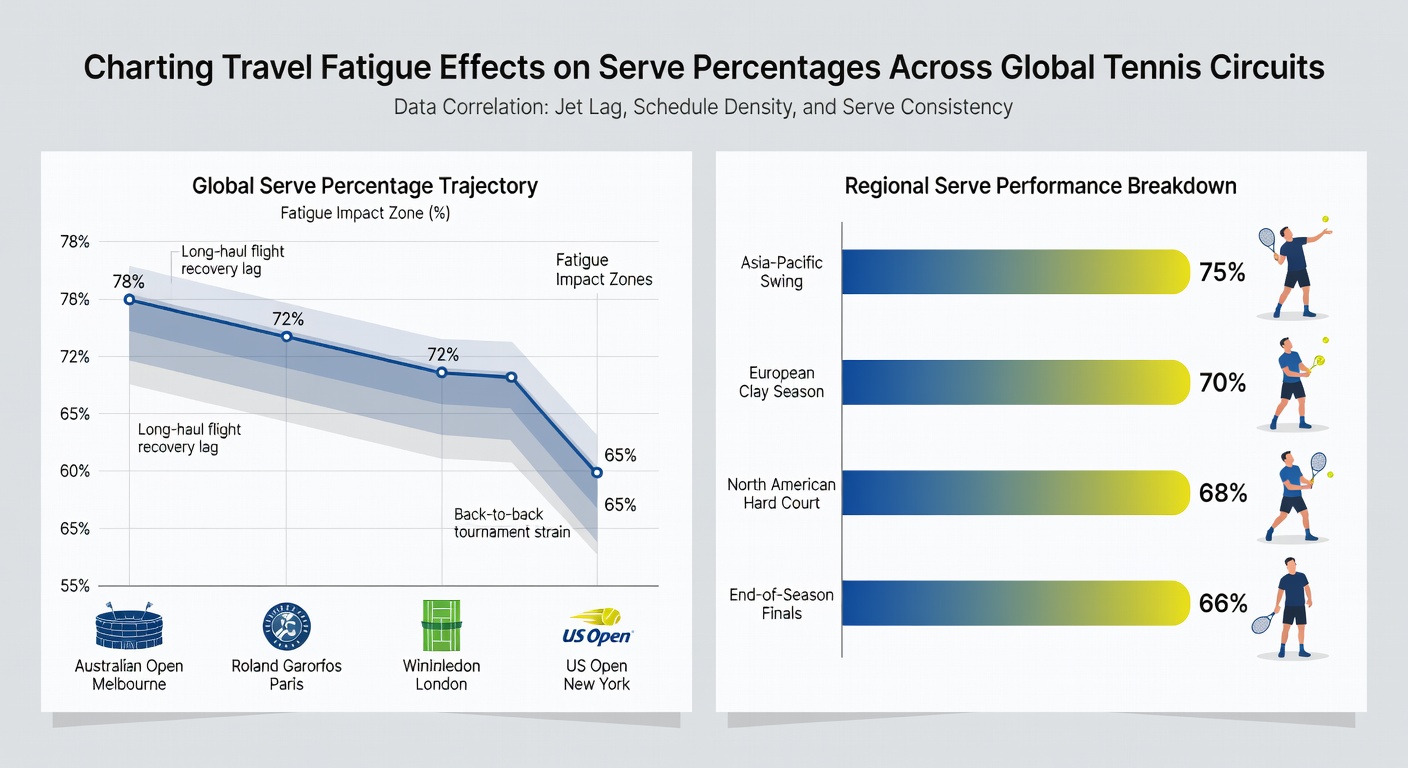
Analyses of match statistics reveal that first-serve percentages drop by an average of three to five points in the 48 hours after flights exceeding eight hours, according to aggregated figures from tournament databases. Second-serve success rates follow a similar trajectory, with players converting fewer points when recovery time falls short of standard rest protocols. Those who studied performance logs from 2024 through early 2026 found the effect intensifies during the Asian swing and the South American clay season, where consecutive long-haul legs occur within short calendar windows.
Players frequently arrive at venues with disrupted circadian rhythms, and this physiological state correlates with reduced accuracy on wide serves and diminished power on flat deliveries. Studies conducted by sports science groups in Australia and the United States have measured these variables through wearable tracking devices that record sleep duration, heart-rate variability, and reaction times upon landing. Results indicate measurable decrements persist even when athletes maintain training routines during transit.
Surface-Specific Impacts Across Circuits
Grass-court events present distinct challenges because the faster surface rewards precise serve placement, yet travel fatigue appears to blunt that precision more sharply than on slower clay. Data collected during the European grass season shows players who traveled from North American hard-court stops posted serve percentages roughly four points lower in their opening matches compared with those who remained on the continent. Clay tournaments in Europe and Latin America exhibit smaller but still detectable dips, primarily in second-serve points won after long flights from Asia or Oceania.
Indoor hard courts in the latter stages of the season produce mixed outcomes; some datasets suggest the controlled environment mitigates certain jet-lag effects, while others record continued declines when cumulative travel distance exceeds 15,000 kilometers within a six-week block. Researchers tracking these variables emphasize that individual recovery capacity varies, yet aggregate trends remain stable across hundreds of player-seasons.
Insights from June 2026 Tournament Windows
During the lead-up to the grass-court major in June 2026, several players navigated tight schedules that included rapid transitions from clay events in Paris to London preparations. Performance analysts recorded first-serve percentages for competitors arriving directly from continental Europe versus those returning from earlier stops in the Middle East, and the latter group showed a statistically noticeable reduction in ace frequency during qualifying rounds. Tournament officials adjusted practice court availability in response, though the underlying travel variables remained outside their control.
Similar observations surfaced at concurrent WTA events on the same surface, where players crossing the Atlantic reported higher rates of double faults in early rounds. These snapshots align with broader longitudinal studies that span multiple years and continents, reinforcing the link between cumulative flight hours and serve metrics rather than attributing changes solely to opponent strength or surface adaptation.
Recovery Protocols and Measurable Outcomes
Teams have implemented structured recovery programs that include timed light exposure, targeted hydration, and adjusted training loads upon arrival, and data indicates these measures can narrow the gap in serve percentages within 72 hours. A project coordinated through Canadian sports institutes tracked athletes who followed such protocols versus those who maintained standard routines, revealing faster stabilization of first-serve points won for the former group. European research centers have reported comparable findings when monitoring heart-rate recovery alongside serve statistics collected at successive tournaments.
Yet the compressed nature of the global calendar limits full implementation for many competitors, especially those ranked outside the top tier who often lack extensive support staff. Figures released by academic groups monitoring elite sport show that even with interventions, residual effects linger when travel intervals shrink below five days between distant venues.
Conclusion
Longitudinal tracking across ATP, WTA, and ITF circuits demonstrates consistent associations between extended travel and modest but repeatable reductions in serve percentages, with surface and scheduling factors modulating the magnitude. Sports science teams continue to refine measurement techniques and recovery strategies, drawing on data from diverse geographic regions to build more precise models. As calendars evolve toward 2027, these documented patterns provide objective benchmarks for evaluating player preparedness at every stage of the season.