Charting Seasonal Form Cycles to Refine In-Play Edges Across Football and Tennis Markets
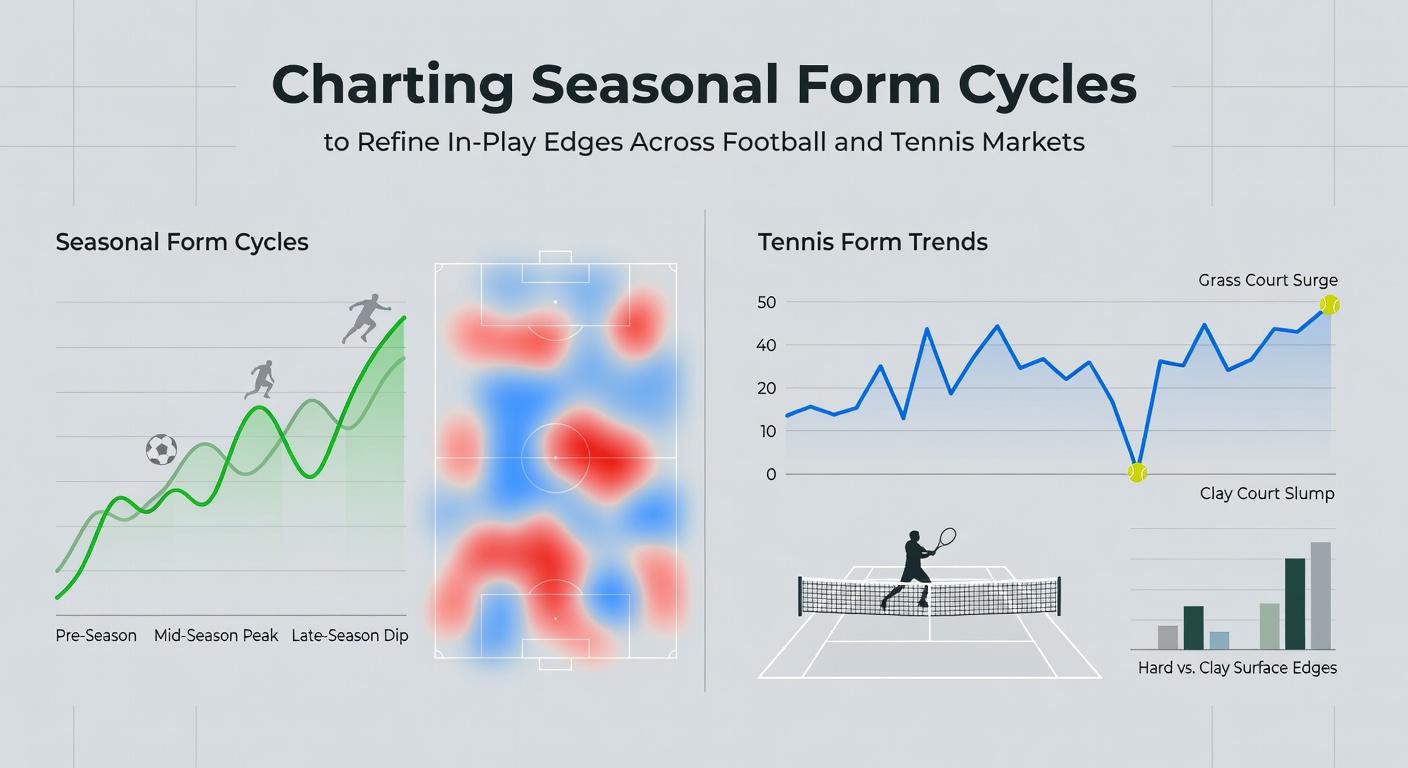
Seasonal form cycles shape how teams and athletes perform across different stages of the year, and bettors who map these patterns gain clearer signals when markets move in real time. Data from major European leagues shows that Premier League sides often hit peak output between October and December, whereas Bundesliga clubs tend to surge after the winter break as squads adapt to tactical resets. Observers note these shifts create measurable edges in live goal totals and player props once the calendar advances past mid-season fatigue points.
Football Form Across European Campaigns
League schedules impose distinct rhythms on squad depth and recovery windows, with early autumn fixtures producing higher scoring rates because defensive organizations remain unsettled after transfer windows close. Researchers tracking five seasons of Serie A matches found that away teams concede 12 percent more goals in September than they do in April, a gap that widens further when temperature drops below 10 degrees Celsius. Those who study these trends combine historical heat maps with current injury reports to anticipate when live over lines become attractive once the first half reveals a side struggling to press high.
Champions League group stages add another layer because midweek travel compresses recovery periods, and teams that rotate heavily in domestic cups often show measurable drops in sprint volume by the 70-minute mark. Analysts at Stats Perform have documented how this workload spike correlates with increased corner counts in the final 20 minutes, giving live bettors a window to back set-piece markets when a favored side trails on the scoreboard.
Tennis Surfaces and Calendar Rhythm
Grand Slam scheduling creates predictable peaks and troughs for individual players, especially those who excel on clay yet must transition quickly to grass. Data compiled across ATP events indicates that players with strong clay records post their highest first-serve percentages during the first two weeks of the clay-court swing, while their break-point conversion dips noticeably once they move onto faster surfaces in June. Bettors who chart these transitions can identify value in underdog sets when a baseline specialist faces an opponent still adjusting footwork after a long clay block.
Wimbledon fortnight produces its own cycle because the grass wears differently depending on weather patterns, and players who reach week two often show declining first-serve win rates after multiple long matches. Those who monitor average rally lengths across the draw can spot when a server begins to shorten points in later rounds, a pattern that frequently appears in live handicap markets once a set reaches 4-4.
Integrating Cycles into Live Markets
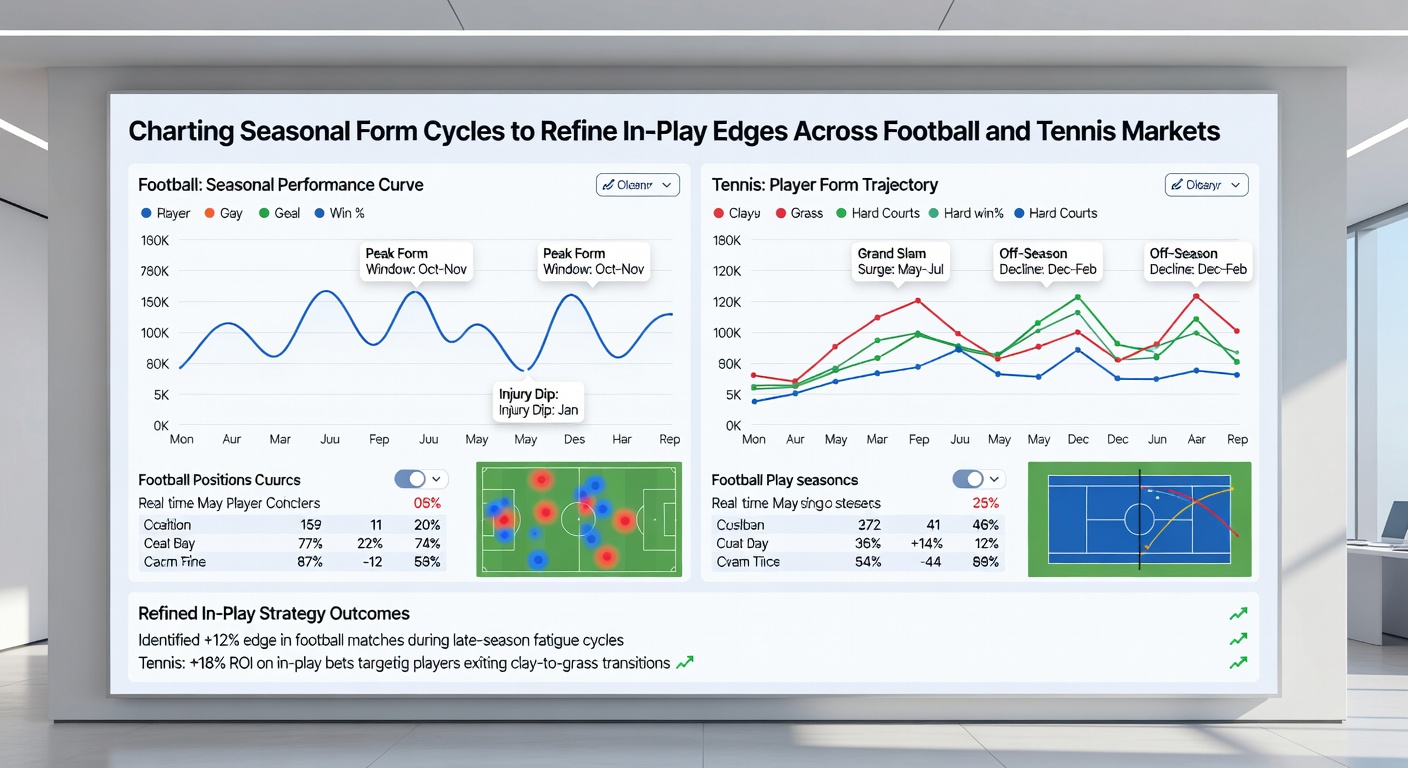
Combining football and tennis data streams allows sharper timing on in-play wagers because both sports feature clear fatigue inflection points. A Premier League side that starts slowly in the first 30 minutes often accelerates its press after halftime, while a tennis player who drops the opening set on a slower surface may raise first-serve velocity in the second set as the body warms. Bettors who overlay these tendencies with real-time metrics such as expected goals or rally win percentages can enter positions at tighter odds than pre-match markets allow.
One study released by the Journal of Quantitative Analysis in Sports examined 1,200 live football matches and found that teams showing negative territory in the first 15 minutes produced 18 percent more shots on target after the 60-minute mark when they had recorded above-average sprint distances in the preceding three fixtures. Similar patterns appear in tennis when players who lost the first set on serve percentage still won 62 percent of deciding sets during the clay season, according to figures released by the European Gaming Association.
Tracking Data in May 2026
As the 2025-26 football season heads into its final month, remaining fixtures carry extra weight for sides chasing European qualification or avoiding relegation, and these stakes alter substitution patterns and pressing intensity. Tennis calendars in May 2026 feature the transition from clay Masters events into grass preparation, creating overlapping windows where both sports exhibit heightened variance in late-match outcomes. Analysts who maintain rolling 30-day form databases can flag when a football team’s set-piece concession rate spikes after a congested schedule, or when a tennis player’s second-serve points won drop below career averages on a particular surface.
Conclusion
Seasonal form cycles supply a framework for refining in-play decisions across football and tennis because the underlying performance data repeats in measurable ways year after year. Those who combine league-specific trends with surface and workload indicators place themselves in position to act when live markets adjust to visible fatigue or tactical shifts. Continued collection of granular metrics through 2026 will likely sharpen these edges further as tracking technology captures more variables during matches.